
What Will You Learn in the Power BI Course?
The Power BI toolset is the central data visualization and reporting pillar of the modern Microsoft analytics ecosystem. It combines two closely integrated functional areas: Data Preparation for data modeling, DAX calculations, and data transformation, and Data Visualization for interactive reporting, dashboard creation, and business insights delivery.
Primary Components of Power BI
Power Query (PQ): Connects to various data sources, transforms and cleans data, and loads it into the data model for reporting.
Data Modeling (DM): Manages relationships, calculated columns, measures, and hierarchies to establish a structured and unified data foundation.
Data Analysis Expressions (DAX): Calculates custom metrics, aggregations, and business logic using formulas to power advanced analytical reports.
Data Visualization (DV): Designs interactive reports, charts, maps, and custom visuals to present actionable business insights clearly.
Power BI Service (PBI Cloud): Manages workspace collaboration, scheduled data refreshes, dashboard sharing, and organizational content distribution.
Real-World Applications and Present-Day Industry Use
Power BI is deployed globally across finance, healthcare, retail, manufacturing, and technology industries:
Financial Services: Streamlining executive financial reporting, expense tracking, risk analysis, and real-time portfolio performance monitoring.
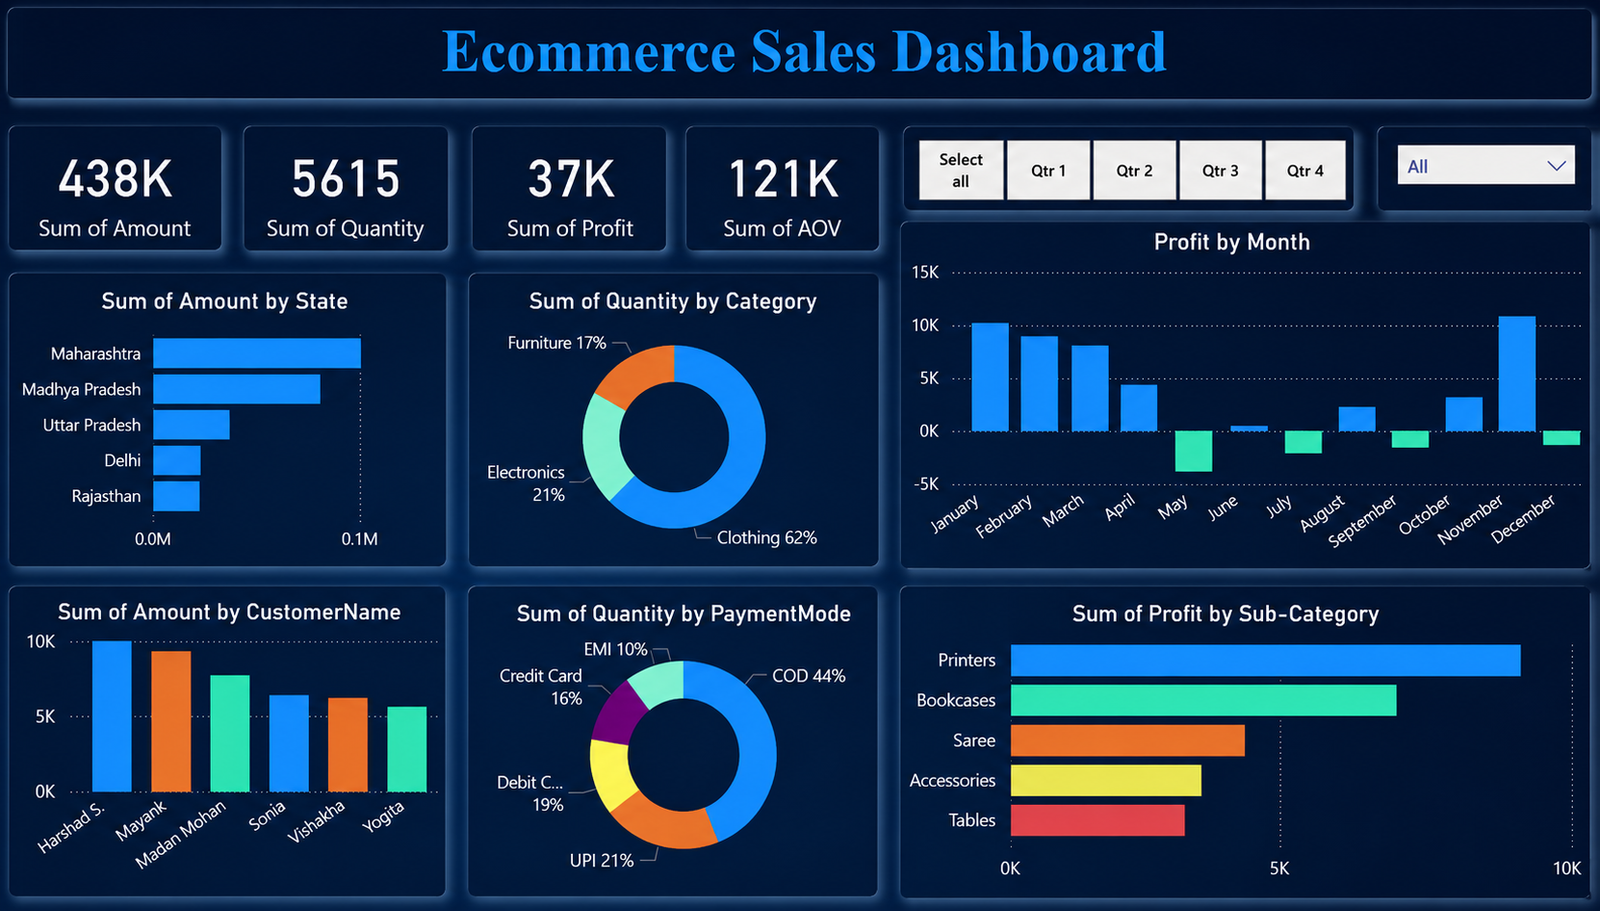
Retail and E-commerce: Managing inventory turnover, customer segmentation, point-of-sale sales trends, and supply chain visibility.
Healthcare Operations: Tracking patient wait times, hospital resource utilization, treatment outcomes, and medical supply distribution.
Manufacturing & Supply Chain: Aligning operational key performance indicators (KPIs), production cycle efficiency metrics, and inventory distribution to minimize bottlenecks and meet market demand.
Future Scope of Power BI
As enterprises modernize their data environments and transition toward data-driven cultures, the scope of Power BI revolves heavily around advanced analytics and intelligent business insights:
Integration with Microsoft Fabric: Mastering the unified analytics architecture connecting core Power BI reports with OneLake, Data Factory, and real-time data engineering.
AI-Powered Insights and Copilot: Utilizing modern, generative AI capabilities for natural language report creation, automated summaries, and smart narrative visualizations.
Advanced Data Modeling and Scalability: Navigating enterprise-scale semantic models, deployment pipelines, and optimized DAX calculations for high-performance reporting.
Embedded Analytics and Real-Time Streaming: Using custom web applications, Power BI Embedded, and streaming datasets to track live operational metrics and deliver actionable insights anywhere.
Eligibility Criteria
Educational Background: Bachelor's or Master's degree in Computer Science, Information Technology, Data Analytics, Statistics, Business Administration, or related fields. Graduates from any discipline with an interest in data analysis, reporting, and business intelligence are also eligible.
Work Experience (Optional): Prior domain experience in data analysis, business intelligence, reporting, database management, or IT consulting is highly beneficial.